Cluster Monitoring
Through cluster monitoring, you can view the basic information of the cluster, the resource consumption
and the trend of resource consumption over a period of time.
Prerequisites
The cluster has insight-agent installed and the application is in running state.
Steps
-
Go to the Insight product module.
-
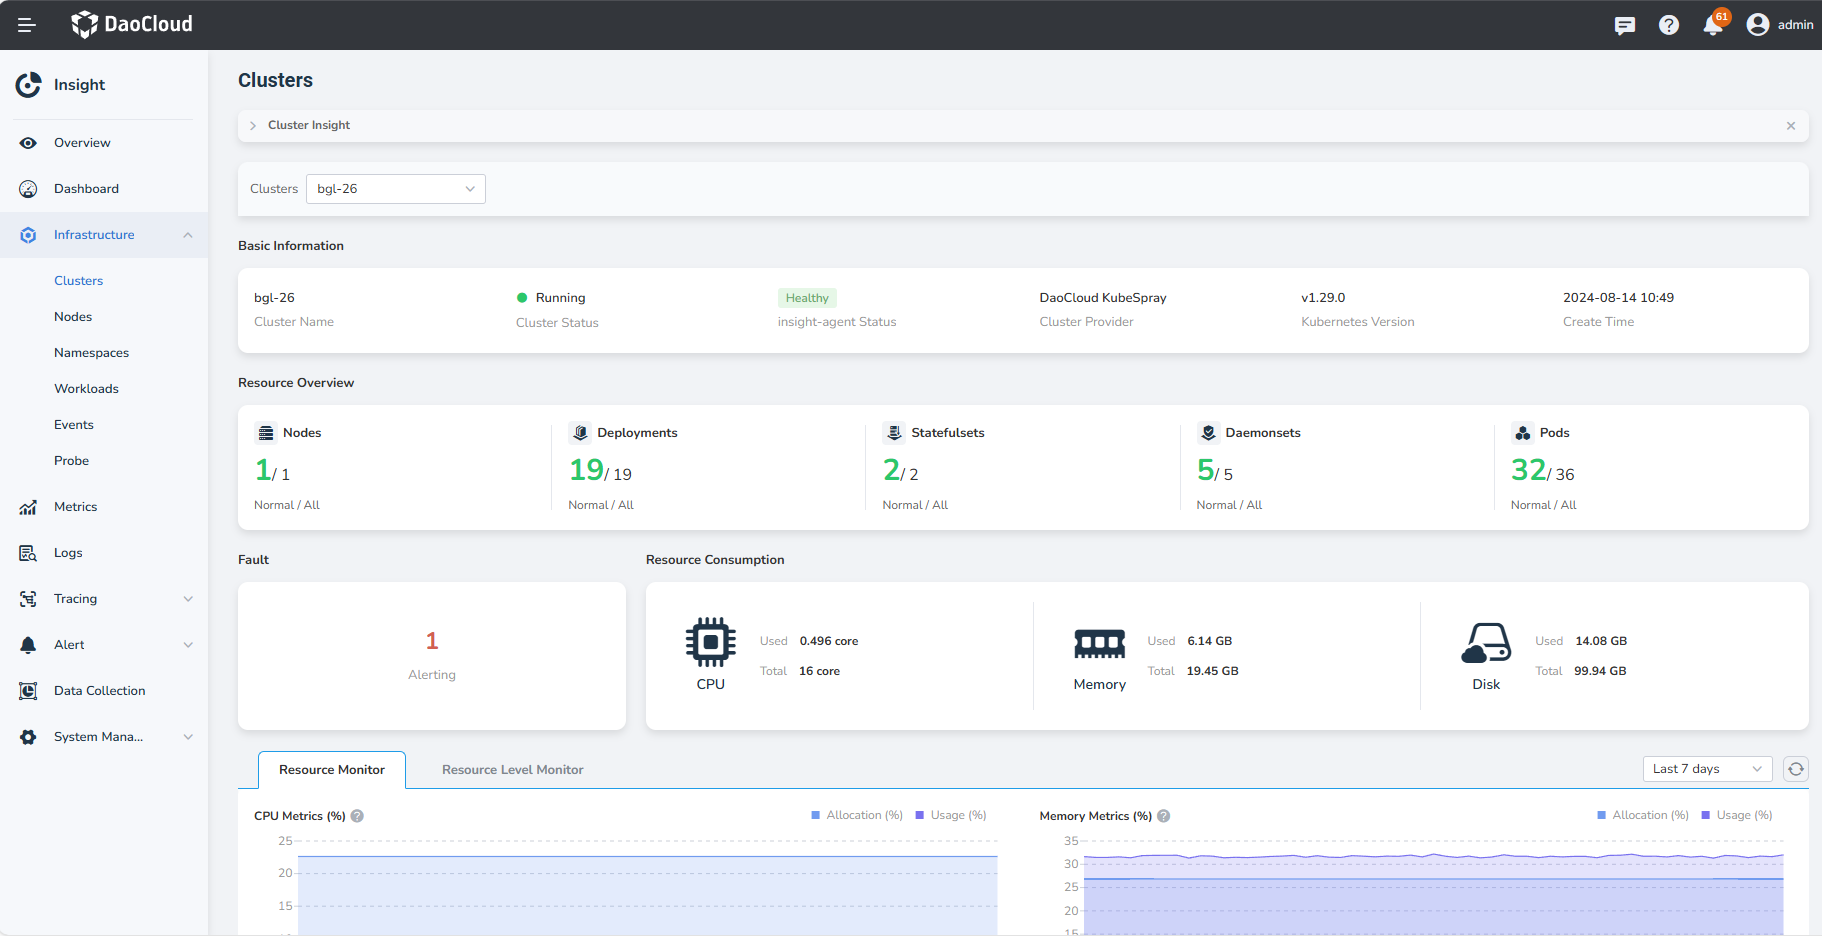
Select Infrastructure > Clusters from the left navigation bar. On this page, you can view the following information:
- Resource Overview: Provides statistics on the number of normal/all nodes and workloads across multiple clusters.
- Fault: Displays the number of alerts generated in the current cluster.
- Resource Consumption: Shows the actual usage and total capacity of CPU, memory, and disk for the selected cluster.
- Metric Explanations: Describes the trends in CPU, memory, disk I/O, and network bandwidth.
-
Click Resource Level Monitor, you can view more metrics of the current cluster.
Metric Explanations
| Metric Name | Description |
|---|---|
| CPU Usage | The ratio of the actual CPU usage of all pod resources in the cluster to the total CPU capacity of all nodes. |
| CPU Allocation | The ratio of the sum of CPU requests of all pods in the cluster to the total CPU capacity of all nodes. |
| Memory Usage | The ratio of the actual memory usage of all pod resources in the cluster to the total memory capacity of all nodes. |
| Memory Allocation | The ratio of the sum of memory requests of all pods in the cluster to the total memory capacity of all nodes. |