Troubleshooting Service Issues with Insight
This article serves as a guide on using Insight to identify and analyze abnormal components in DCE 5.0 and determine the root causes of component exceptions.
Please note that this post assumes you have a basic understanding of Insight's product features or vision.
Service Map - Identifying Abnormalities on a Macro Level
In enterprise microservice architectures, managing a large number of services with complex interdependencies can be challenging. Insight offers service map monitoring, allowing users to gain a high-level overview of the running microservices in the system.
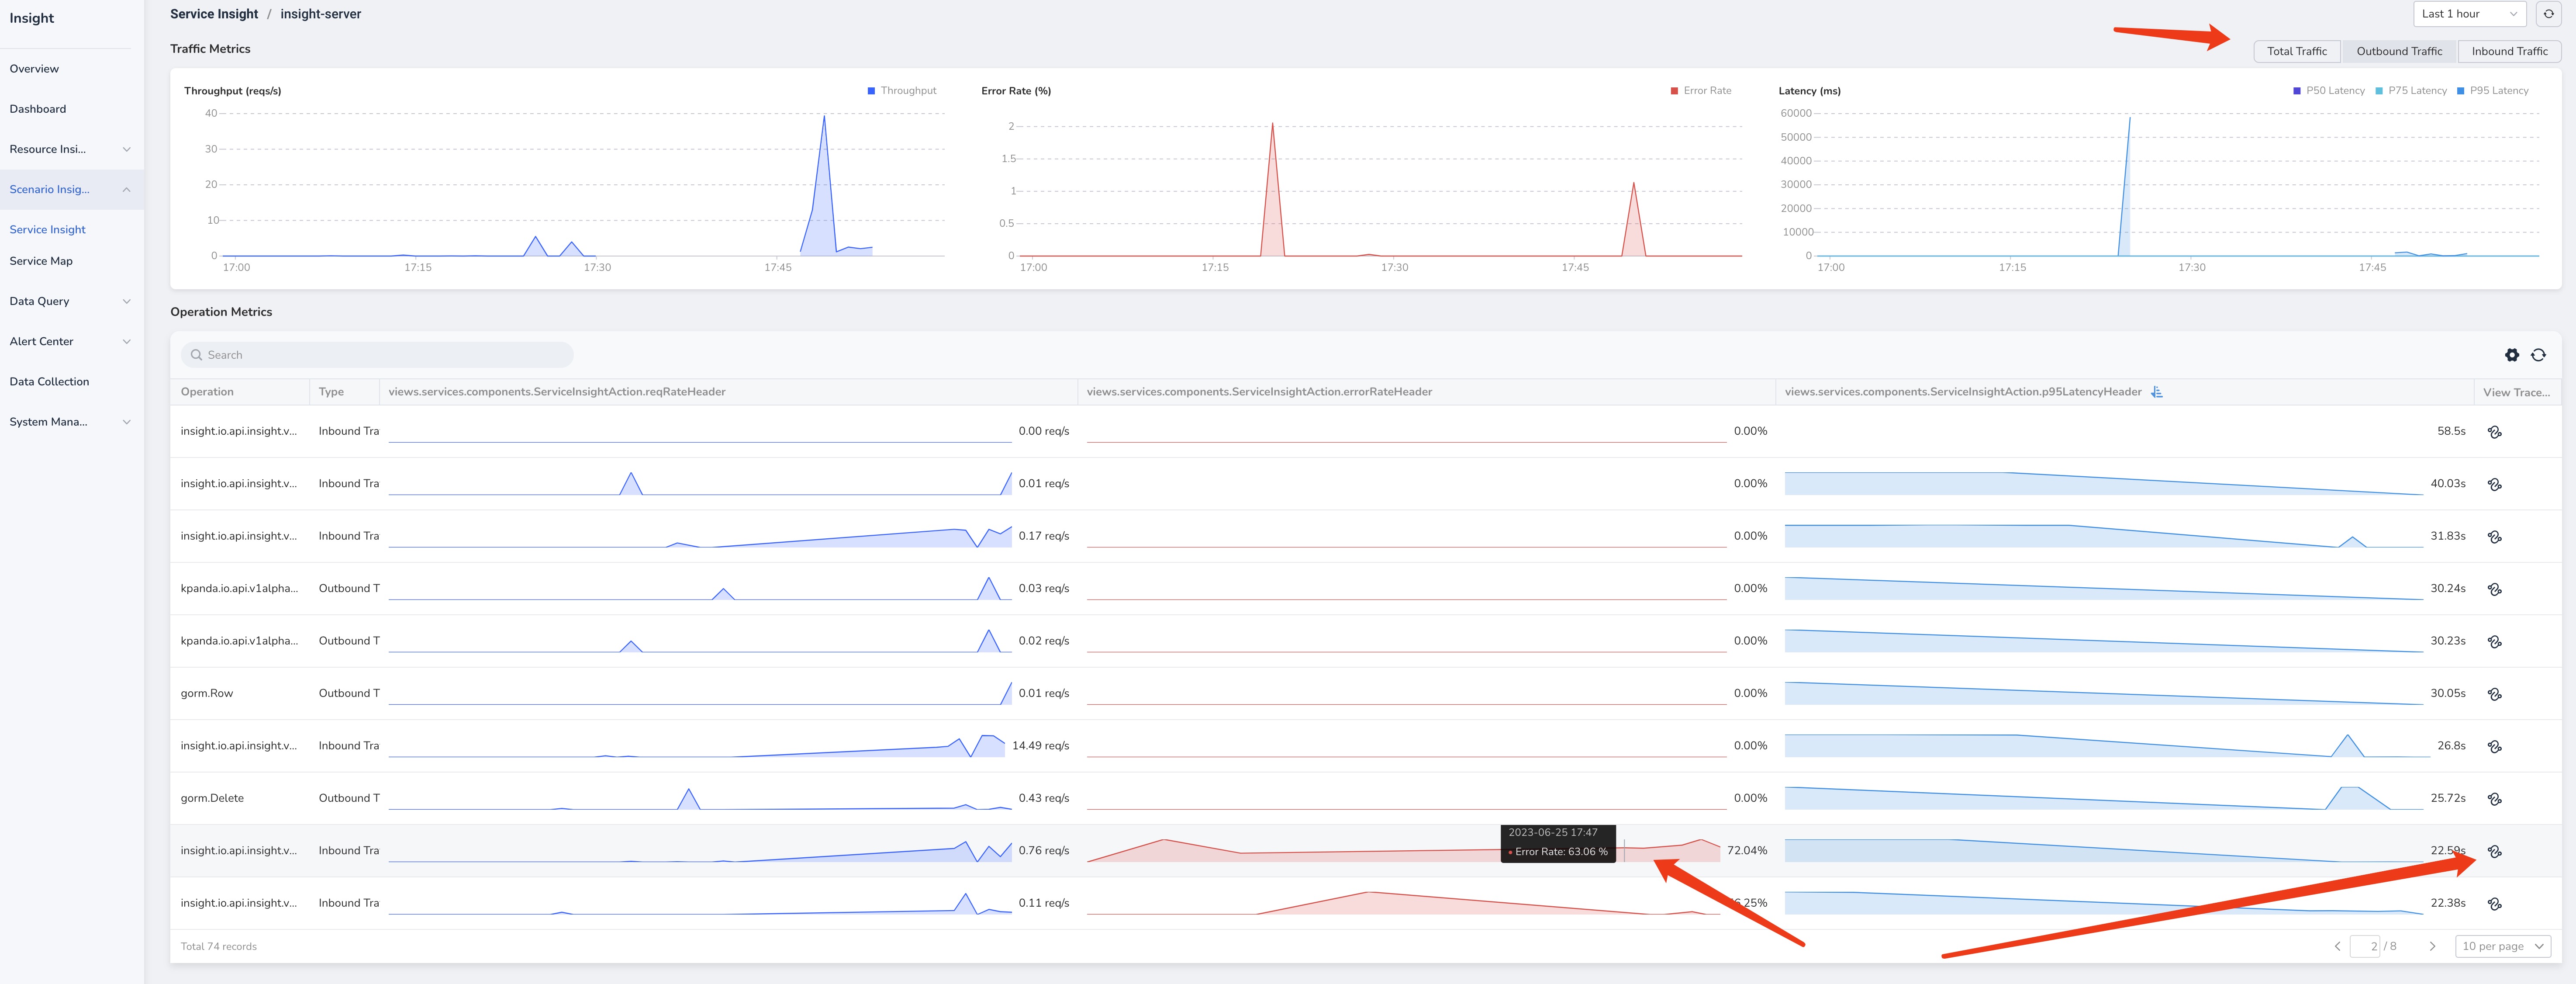
In the example below, you observe that the node insight-server is highlighted in red/yellow on the service map. By hovering over the node, you can see the error rate associated with it. To investigate further and understand why the error rate is not 0 , you can explore more detailed information:
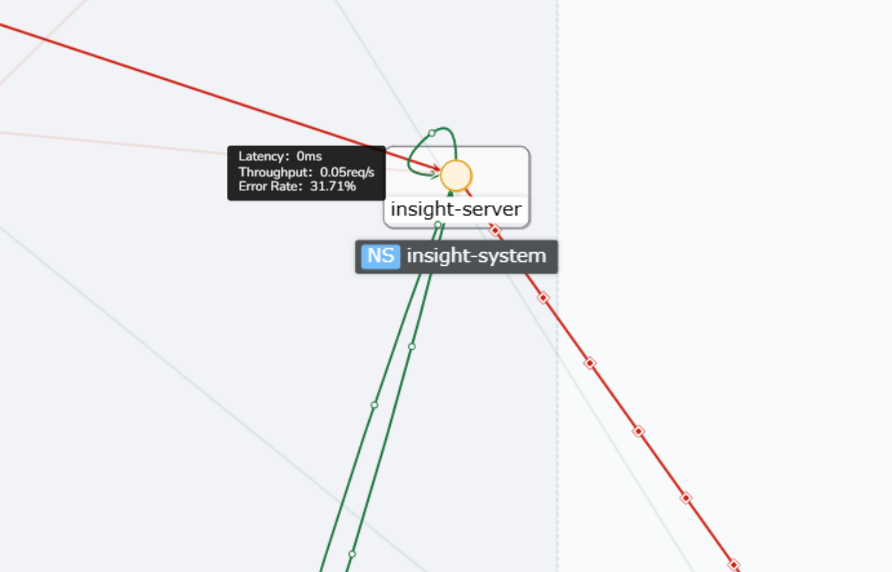
Alternatively, clicking on the service name at the top will take you to the service's overview UI:
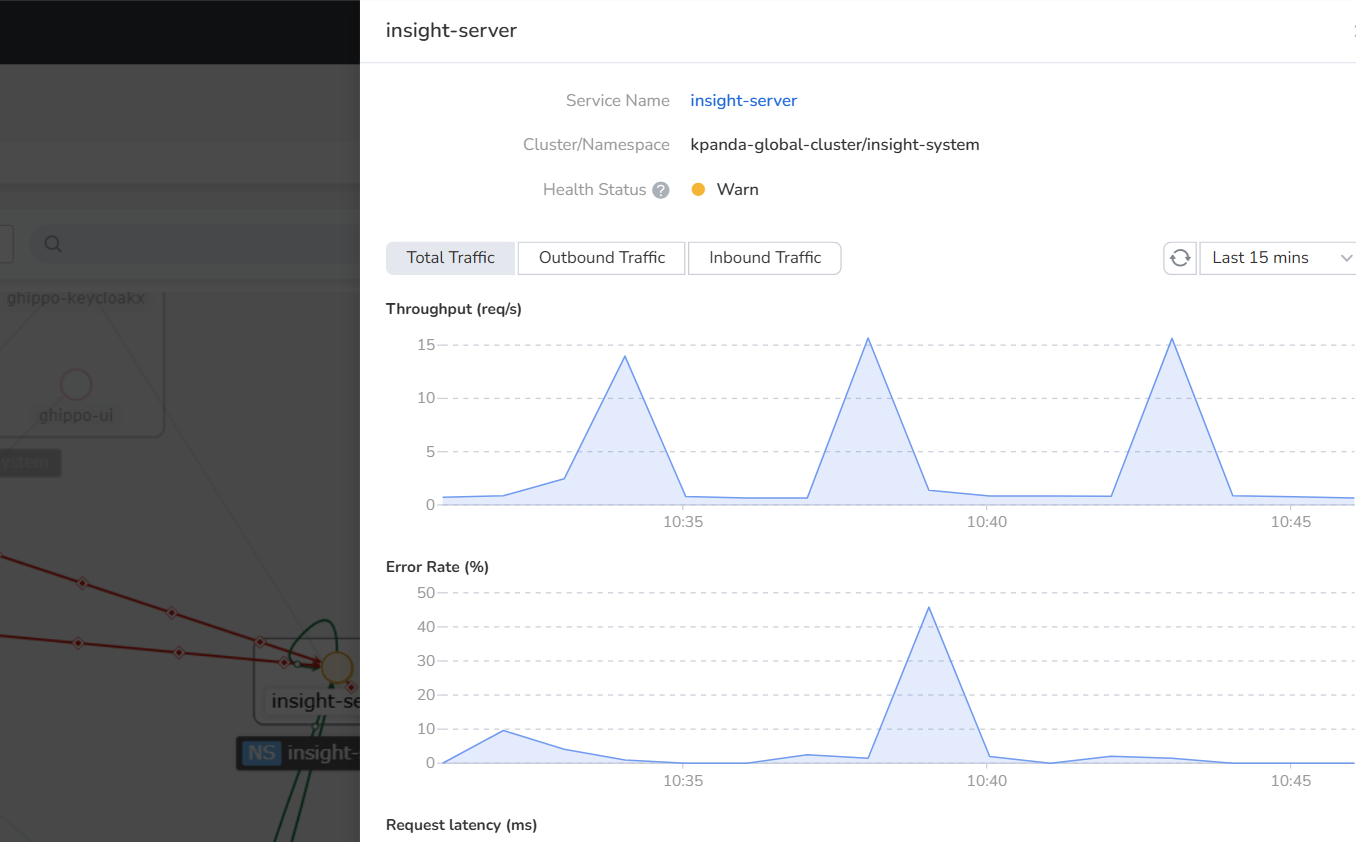
Service Overview - Delving into Detailed Analysis
When it becomes necessary to analyze inbound and outbound traffic separately, you can use the filter in the upper right corner to refine the data. After applying the filter, you can observe that the service has multiple operations corresponding to a non-zero error rate. To investigate further, you can inspect the traces generated by these operations during a specific time period by clicking on "View Traces":
Trace Details - Identifying and Eliminating Root Causes of Errors
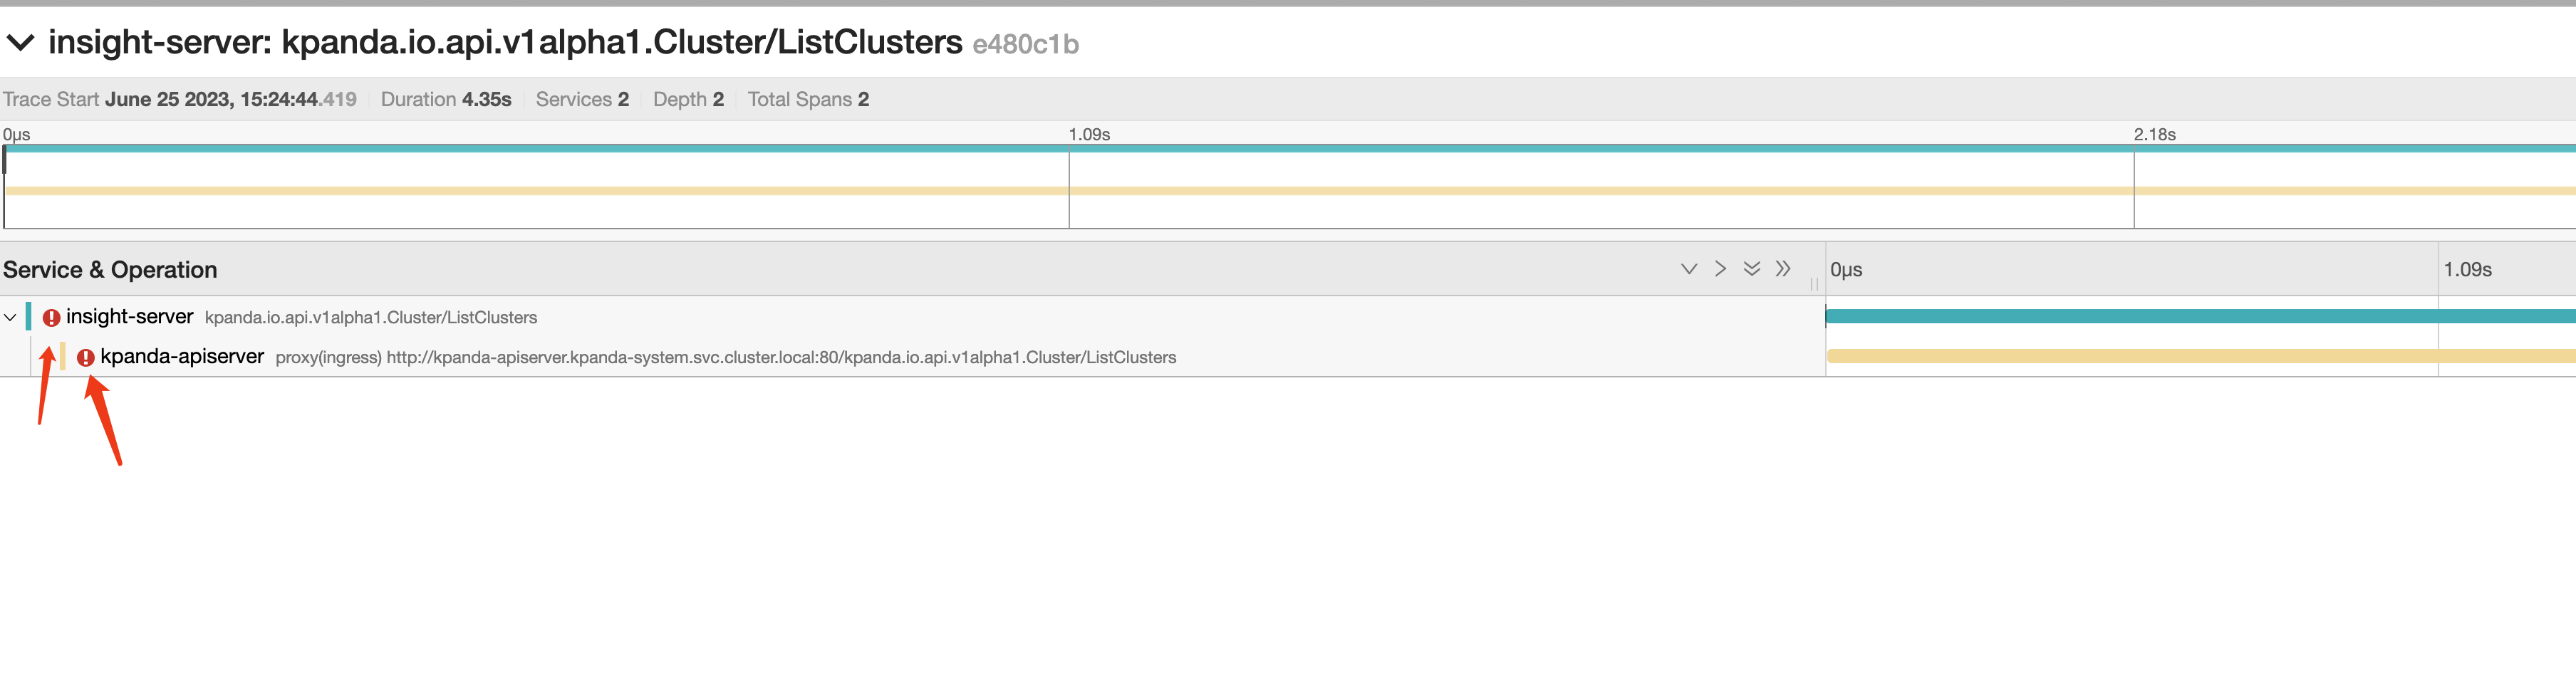
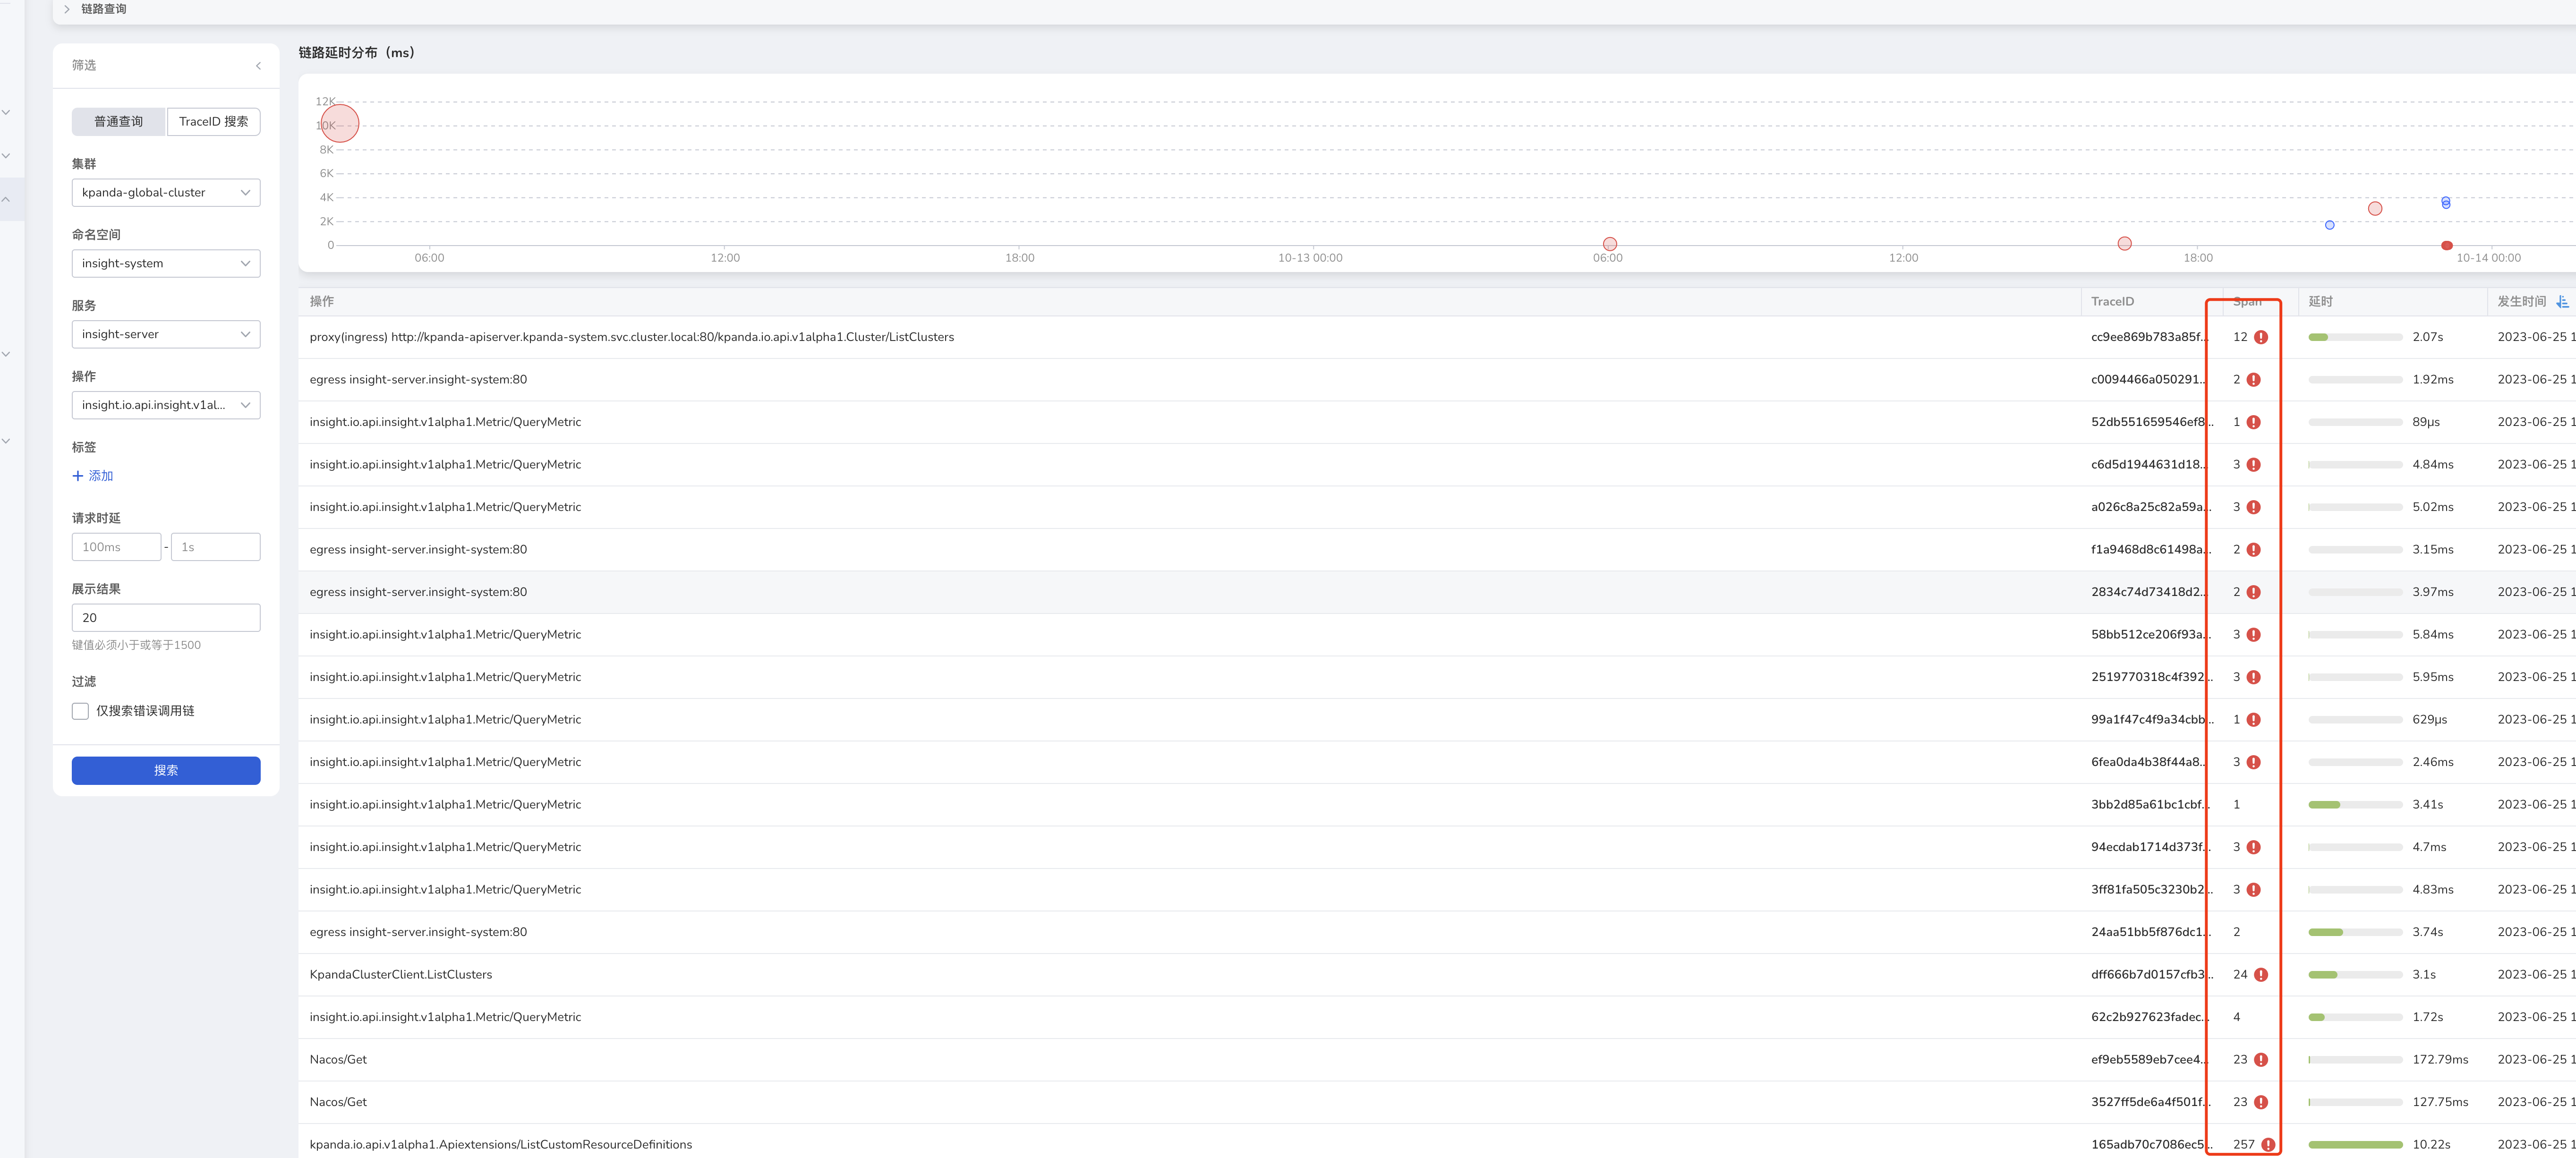
In the trace list, you can easily identify traces marked as error (circled in red in the figure above) and examine their details by clicking on the corresponding trace. The following figure illustrates the trace details:
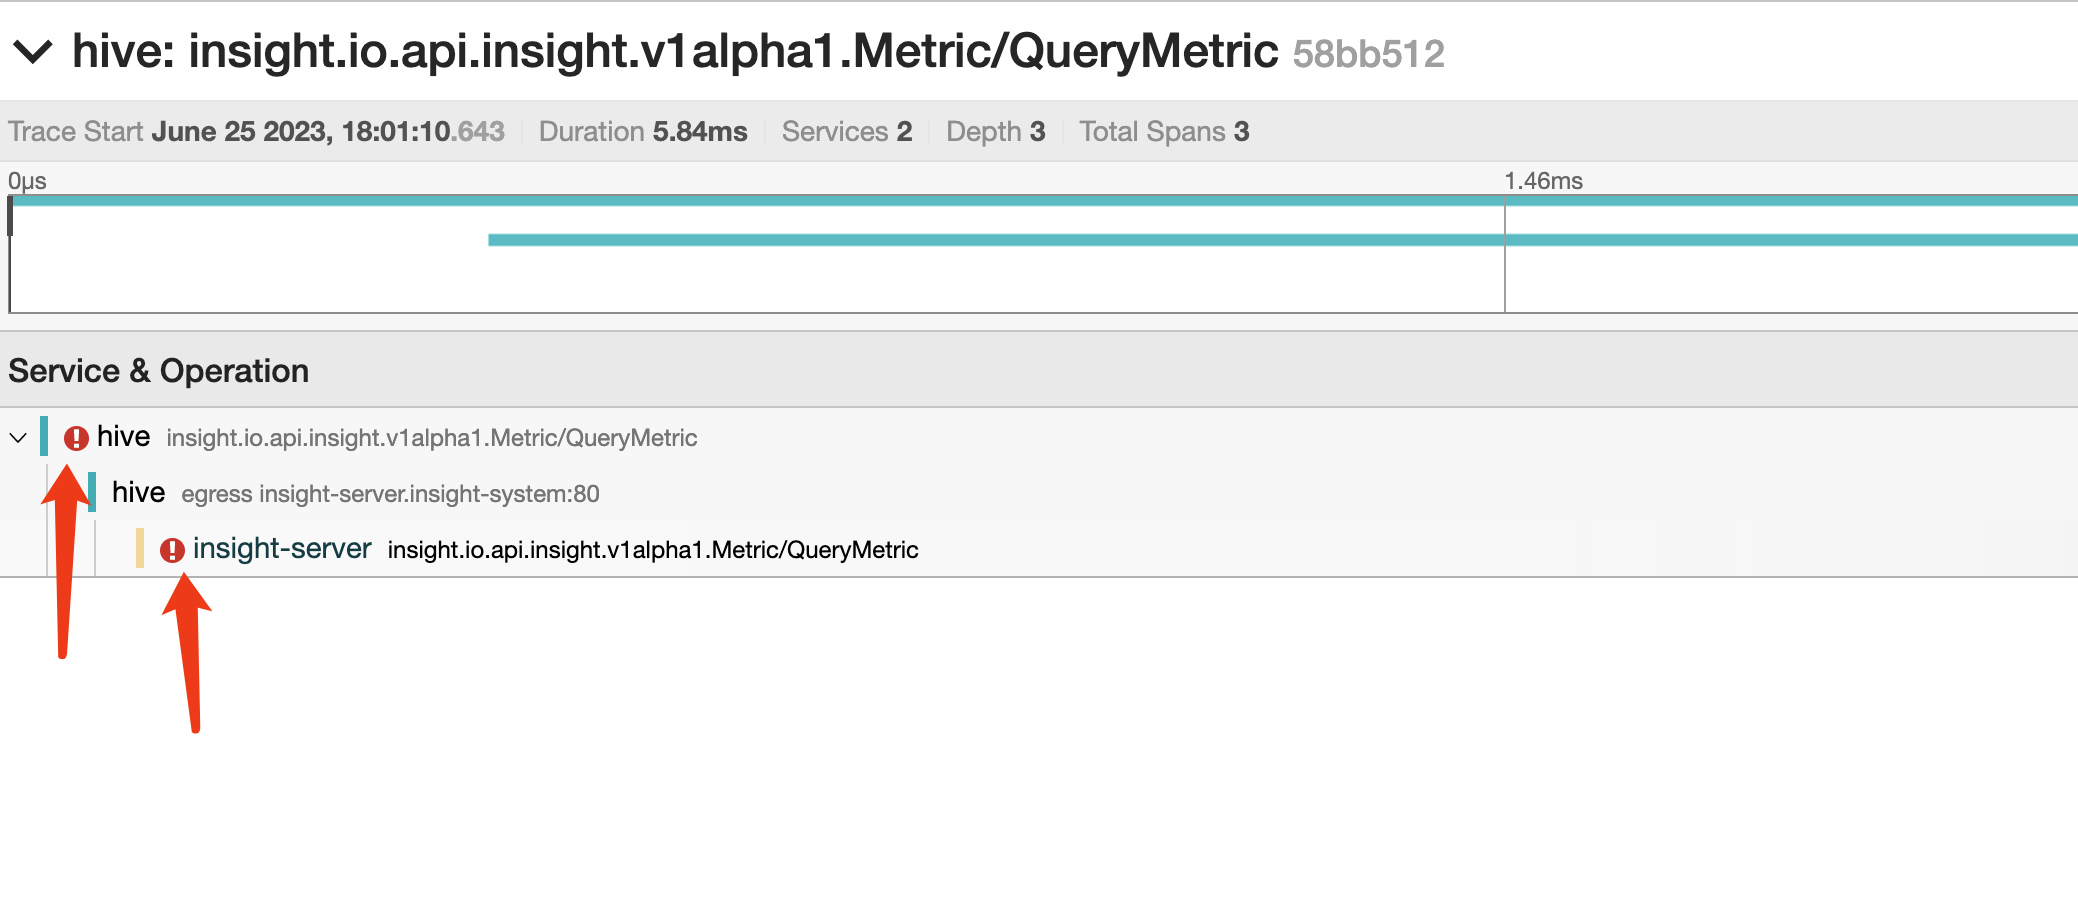
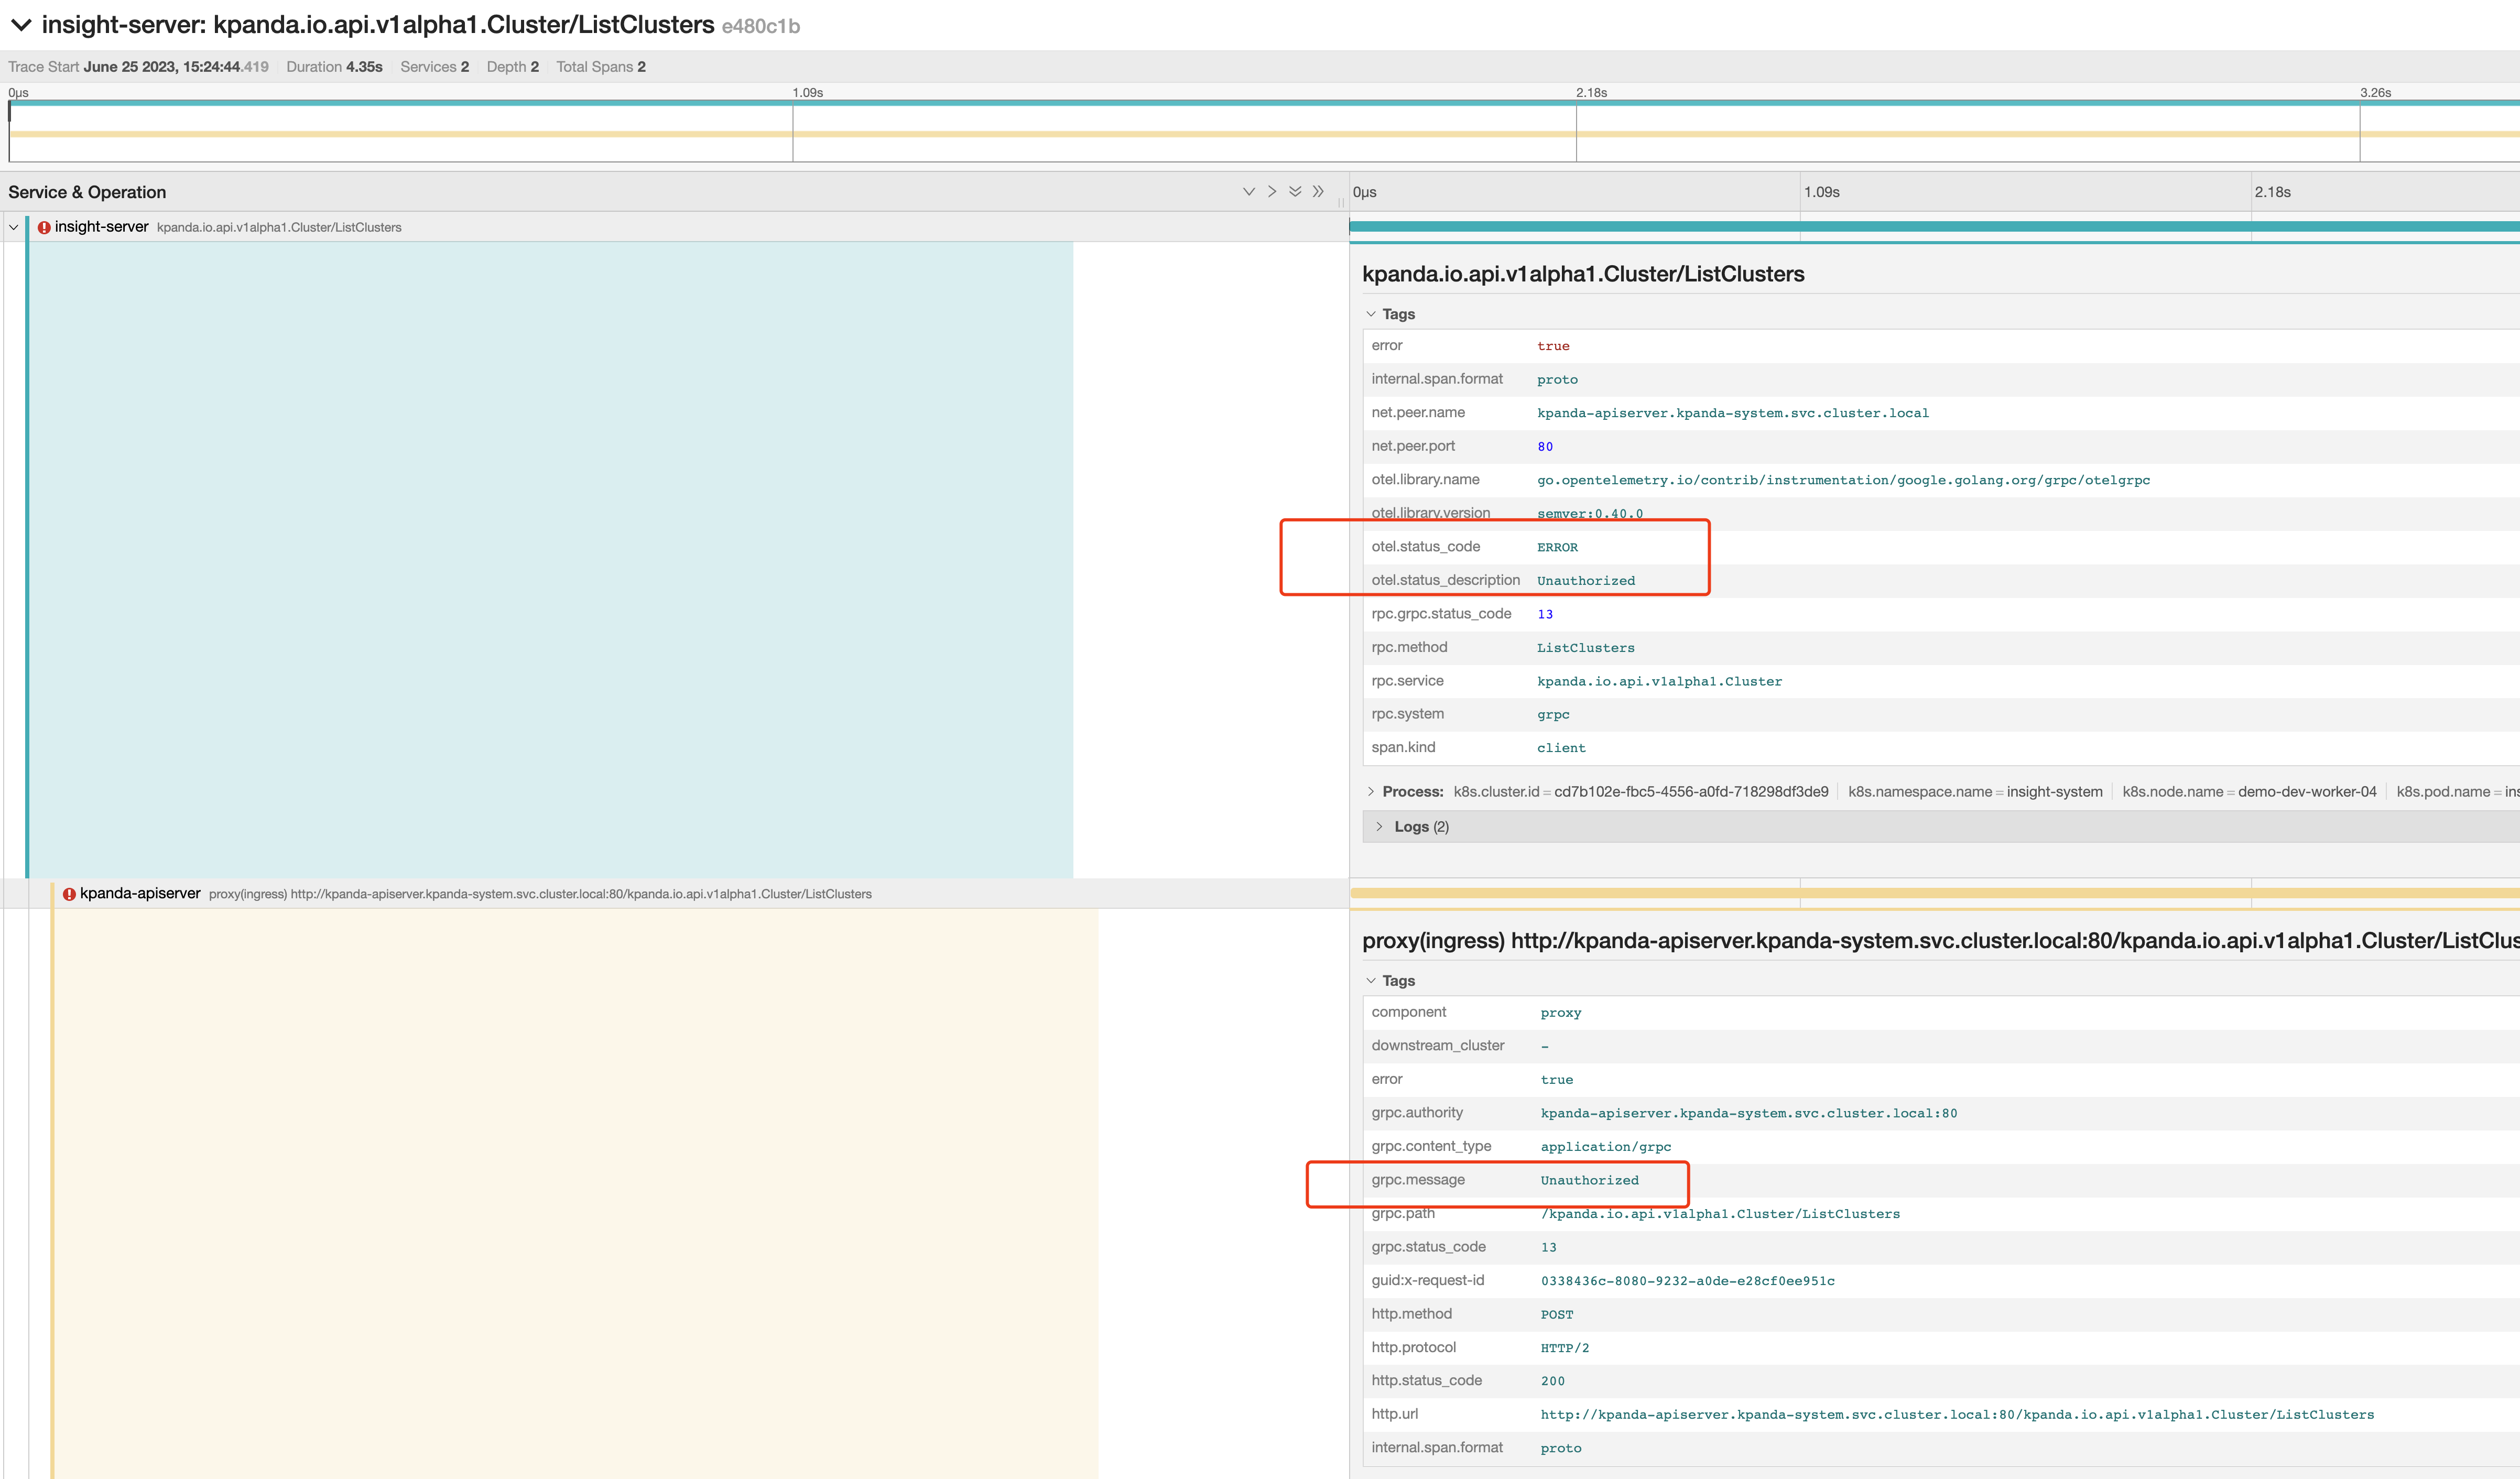
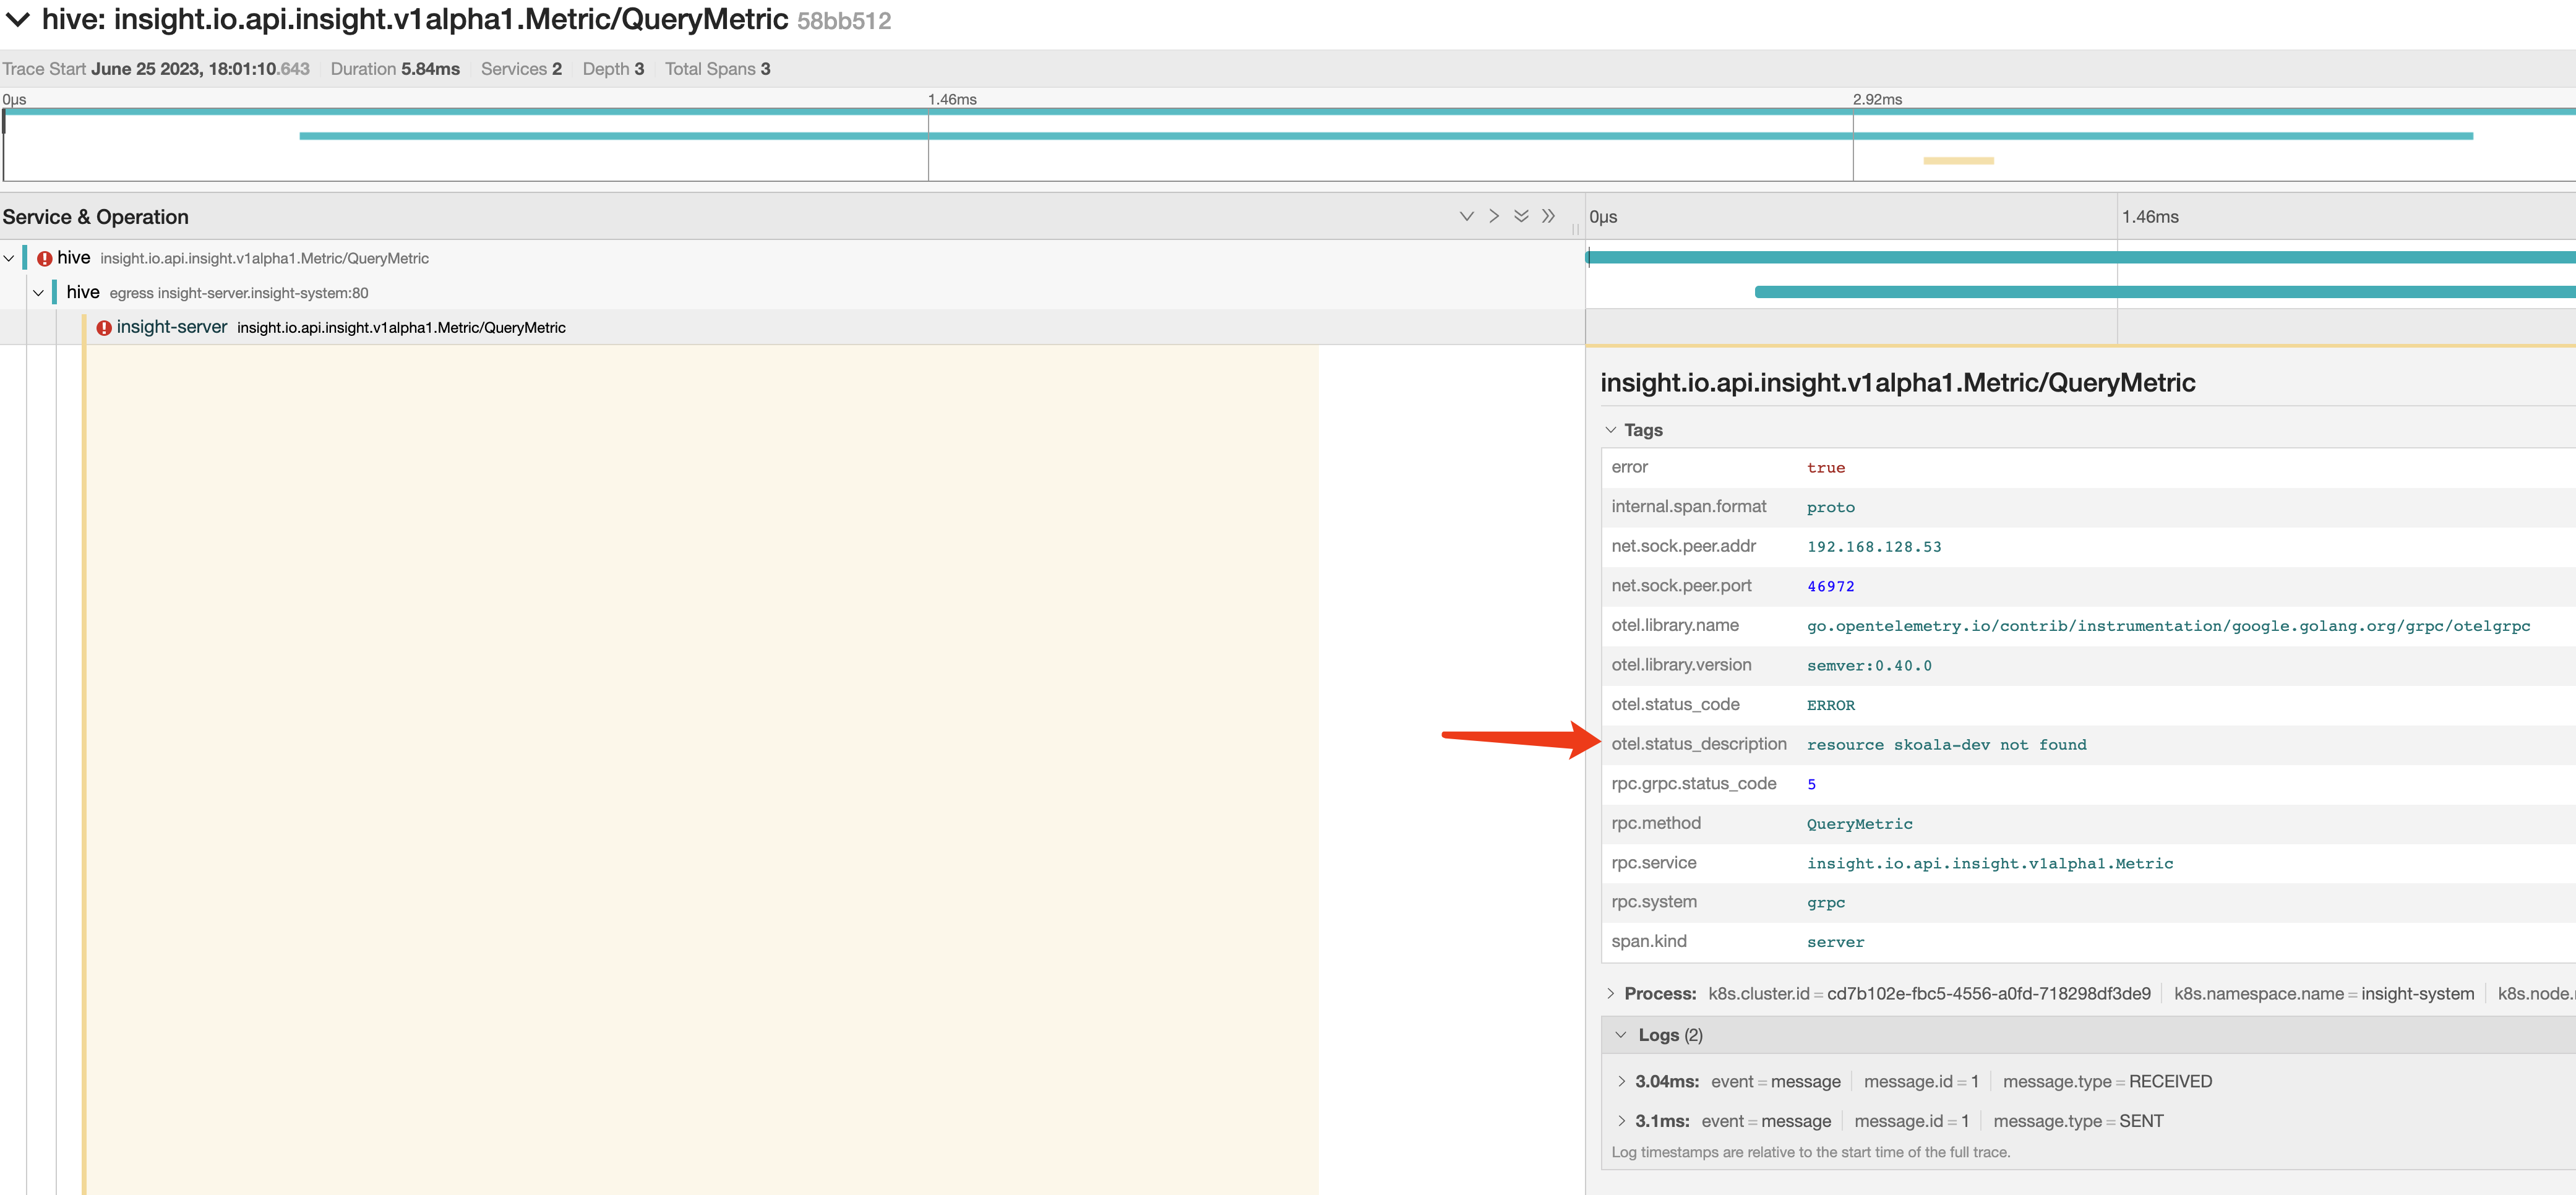
Within the trace diagram, you can quickly locate the last piece of data in an error state. Expanding the associated logs section reveals the cause of the request error:
Following the above analysis method, you can also identify traces related to other operation errors: